Momentum Vector Physicsp = mv Arrow Scaling & Mass-Velocity Tradeoff
Introduction
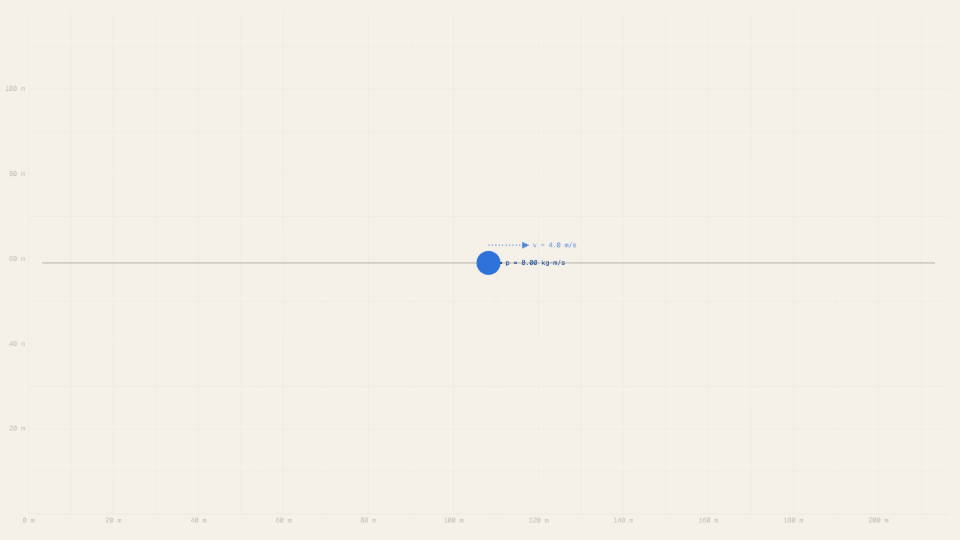
Momentum is the product of an object's mass and its velocity, written p = mv, and it is a vector quantity: its direction matches the sign of velocity. A cart moving rightward at 4 m/s carries positive momentum; the same cart moving leftward carries negative momentum of equal magnitude. The simulator renders this as a navy arrow anchored to the cart, scaled so that the full arrow length corresponds to 100 kg·m/s. At m = 2 kg and v = 4 m/s, the p readout shows 8.00 kg·m/s and the arrow occupies 8% of its maximum length.
Momentum is conserved in every isolated system. When two carts collide on a frictionless track, the total momentum before contact equals the total after, regardless of how individual velocities redistribute. Kinetic energy follows a different rule: conserved only in elastic collisions, dissipated as heat or deformation in inelastic ones. Both quantities depend on mass and velocity, yet they obey distinct conservation laws.
Many expect a heavier cart and a lighter cart at the same momentum to behave identically in every respect. The KE readout contradicts that directly. Setting m = 8 kg and v = 2 m/s produces p = 16.00 kg·m/s and KE = 16.00 J; switching to m = 2 kg and v = 8 m/s keeps the arrow the same length (p = 16.00 kg·m/s) but raises the KE readout to 64.00 J, four times higher. Equal arrows, unequal energies.
The Physics Explained
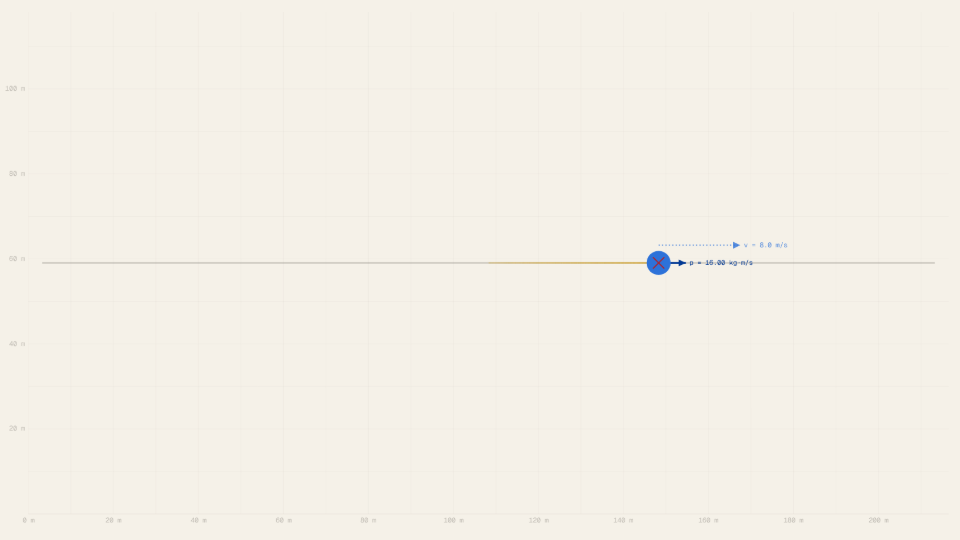

At m = 2 kg and v = 4 m/s, the physics module computes p = 2.0 × 4.0 = 8.00 kg·m/s. The navy arrow rendered on the canvas is scaled so that p = 100 kg·m/s would fill the full 40-world-metre arrow length; at p = 8 kg·m/s the arrow spans 8/100 × 40 = 3.2 world metres, which the p readout confirms at 8.00 kg·m/s. A second sky-blue dotted arrow above the cart encodes the velocity on its own scale (full length at 10 m/s), so its length is not comparable with the momentum arrow: at the defaults it is in fact the longer of the two, because v = 4 m/s is 40% of the velocity scale while p = 8 kg·m/s is only 8% of the momentum scale. Compare momentum arrows with other momentum arrows, run against run. Both arrows point rightward because v is positive; setting v = −4 m/s flips both arrows leftward while the p readout reports −8.00 kg·m/s, illustrating the vector nature of momentum.
The cart body radius also scales with mass: the rendering formula sets r proportional to sqrt(m), so a 10 kg cart appears noticeably larger than a 0.5 kg cart on the same canvas. This visual encoding lets the reader see the mass-velocity tradeoff in spatial terms: a large, slow cart and a small, fast cart can produce arrows of identical length, but the bodies differ in size. At m = 8 kg, v = 2 m/s and at m = 2 kg, v = 8 m/s the p readout locks at 16.00 kg·m/s for both configurations, confirming that the arrow encodes only the momentum magnitude and direction, not the mass or velocity individually.
Kinetic energy diverges from momentum precisely because the velocity term enters quadratically. The KE formula KE = ½mv² can be rewritten as KE = p²/(2m), which shows that for a fixed momentum p, kinetic energy falls as mass rises. At m = 8 kg, v = 2 m/s: KE = 16²/(2 × 8) = 16.00 J. At m = 2 kg, v = 8 m/s: KE = 16²/(2 × 2) = 64.00 J. The factor-of-four difference between these two equal-momentum configurations is visible on the KE readout in the simulator even before the cart moves, because the readouts update live as the sliders change.
Position evolves by constant-velocity integration: x(t) = x₀ + v·t, with x₀ = 0 at each run. At m = 2 kg, v = 4 m/s and run time t = 5 s, the cart reaches x = 0 + 4.0 × 5.0 = 20.0 m before the stop marker appears. The ghost-trail overlay retains up to eight previous runs so that consecutive configurations can be compared spatially: a lighter, faster cart will have traveled farther at the same run time even when both share the same momentum arrow length.
Key Equations
At the default settings of m = 2 kg and v = 4 m/s, the formula gives p = 2.0 × 4.0 = 8.00 kg·m/s. The p readout in the simulator shows exactly 8.00 kg·m/s before and during the run. Because v enters linearly, doubling mass at fixed velocity doubles p, and the navy arrow doubles in length; doubling velocity at fixed mass also doubles p and also doubles the arrow. Both changes produce the same arrow, but the kinetic-energy consequences are different, as the next equation shows.
At m = 2 kg and v = 4 m/s: KE = 0.5 × 2.0 × 4.0² = 0.5 × 2.0 × 16.0 = 16.00 J, confirmed by the KE readout. Because v enters squared, doubling velocity at fixed mass quadruples KE even though it only doubles p. Setting m = 2 kg and v = 8 m/s keeps the equal-momentum comparison in reach: p = 16.00 kg·m/s (same as m = 8, v = 2) but KE = 0.5 × 2.0 × 64.0 = 64.00 J against 16.00 J for the heavier configuration.
This rearrangement makes the mass-velocity tradeoff explicit. For a fixed p, KE is inversely proportional to m: heavy-slow configurations store less kinetic energy than light-fast ones with the same momentum. At p = 8 kg·m/s and m = 2 kg: KE = 64 / (2 × 2) = 16.00 J. At p = 8 kg·m/s and m = 8 kg: KE = 64 / (2 × 8) = 4.00 J, a factor of four lower. The two runs produce identical arrow lengths on the canvas but the KE readout separates them immediately, making the formula's prediction testable without any additional calculation.
With x₀ = 0 (cart always starts at world centre), m = 2 kg, v = 4 m/s, and run time set to 5 s: x(5) = 0 + 4.0 × 5.0 = 20.0 m. The stop marker lands at that position on the canvas track. Setting v = −4 m/s produces x(5) = −20.0 m, with the stop marker on the left side of the track and both arrows flipped to point leftward. No net force acts on the cart between start and stop, so velocity is constant throughout and the position grows linearly.
Key Variables
| Symbol | Name | Unit | Meaning |
|---|---|---|---|
| m | Mass | kg | Inertial mass of the cart; controls arrow length and cart body size |
| v | Velocity | m/s | Signed velocity of the cart; positive = rightward, negative = leftward |
| p | Momentum | kg·m/s | Product m·v (mass times the velocity vector); encoded as the navy arrow length and direction |
| KE | Kinetic energy | J | ½mv²; not equal for all (m, v) pairs sharing the same p |
| x | Position | m | Horizontal displacement from start; grows as x₀ + v·t |
| t | Time | s | Elapsed simulation time; run stops at the Run Time slider value |
Real World Examples

Why is a fast tennis ball more dangerous than a slow bowling ball carrying the same momentum?
Two objects can carry identical momentum while storing very different amounts of kinetic energy. A bowling ball (m = 8 kg) rolling at 2 m/s and a tennis ball (m = 0.5 kg) moving at 32 m/s both carry p = 16 kg·m/s, but the tennis ball holds KE = ½ × 0.5 × 32² = 256 J while the bowling ball holds only KE = ½ × 8 × 2² = 16 J, a 16-fold difference. The tennis ball deposits far more energy on impact, which is what actually causes tissue damage, not the momentum alone.
The simulator makes this visible within its slider range. Setting m = 8 kg and v = 2 m/s puts the p readout at 16.00 kg·m/s and the KE readout at 16.00 J. Switching to m = 2 kg and v = 8 m/s holds the navy arrow at the same length (p = 16.00 kg·m/s) while the KE readout climbs to 64.00 J, four times higher. The ghost-trail overlay from the two runs shows carts that traveled to different positions in the same run time, since x(t) = v·t differs when v differs despite equal p.
This distinction is one reason pedestrian safety guidance emphasises impact speed: injury risk rises steeply with speed, and the v² growth of kinetic energy is an important part of why. Momentum still matters to the collision, and neither quantity alone determines the severity of injury, which also depends on how the force is spread over time, on geometry and on vehicle structure. Two vehicles with the same momentum at different speeds present very different hazards, exactly as the KE = p²/(2m) relationship predicts and the simulator's readouts confirm.
How do vehicle safety engineers use momentum and energy separately when designing crumple zones?
A crumple zone must absorb the kinetic energy of the crash, not merely redirect the momentum. Two vehicles with the same momentum can carry very different kinetic energies depending on how that momentum is split between mass and speed. A compact car (m = 1200 kg) at 13.3 m/s and an SUV (m = 2400 kg) at 6.67 m/s both carry roughly 16 000 kg·m/s of momentum, but the compact holds KE ≈ 106 kJ while the SUV holds KE ≈ 53 kJ. The crumple zone of the faster, lighter vehicle must absorb twice the energy even though the two vehicles' momentum vectors are equal in magnitude.
Engineers therefore size structural deformation zones to the kinetic-energy budget of the worst-case impact speed. Momentum determines what happens to the combined wreck post-impact (how fast it slides after the collision), while kinetic energy determines how much crushing the structure must perform to bring the occupant compartment to rest safely. These are separate design constraints sourced from the same two variables.
The simulator captures both constraints on its readout panel simultaneously. At m = 8 kg and v = 2 m/s, p = 16.00 kg·m/s and KE = 16.00 J. At m = 2 kg and v = 8 m/s, p remains 16.00 kg·m/s but KE reads 64.00 J. A crumple zone sized for the first configuration would be dangerously undersized for the second, even though a momentum-only analysis would call them equivalent. That is precisely the engineering insight KE = p²/(2m) encodes.
Why do rockets burn propellant at high exhaust velocity rather than ejecting large masses slowly?
Rocket thrust follows from conservation of momentum: every kilogram of exhaust ejected backward at velocity ve pushes the rocket forward with an equal and opposite momentum p = me · ve. The same momentum increment can be achieved by ejecting a large mass slowly or a small mass quickly, but the kinetic energy deposited into the exhaust scales as KE = ½ · me · ve². High exhaust velocity is propellant-efficient because it delivers more momentum per kilogram of propellant; the price is energy, since the momentum bought per joule, p/KE = 2/ve, actually falls as exhaust speed rises.
The simulator frames this tradeoff directly. At m = 8 kg and v = 1 m/s, p = 8.00 kg·m/s and KE = 4.00 J. At m = 2 kg and v = 4 m/s, p = 8.00 kg·m/s and KE = 16.00 J. Ejecting a small mass at high speed costs four times the energy for the same momentum gain. The relevant figure of merit for a rocket engine, however, is momentum gained per unit of propellant mass, not momentum per joule, and that figure rises with exhaust speed. Ion thrusters carry this to the extreme: at m = 0.5 kg and v = 10 m/s the readouts show p = 5.00 kg·m/s and KE = 25.00 J, while the same p from m = 5 kg at v = 1 m/s costs only KE = 2.50 J but depletes propellant far faster. Ion engines trade energy efficiency for propellant efficiency, exactly the tradeoff p = mv and KE = ½mv² together encode.
Further Reading
- Elastic collisions: how momentum conservation and kinetic-energy conservation together constrain post-collision velocities, including the equal-mass velocity swap.
- Inelastic collisions: what happens to momentum and kinetic energy when objects stick together or deform on contact.
- Newton's third law carts: the force-pair origin of momentum conservation and how equal-opposite impulses keep total momentum constant during every interaction.
- Kinetic energy vs velocity: the quadratic KE = ½mv² relationship explored through a dedicated simulator that sweeps velocity at fixed mass.