Bounce on Grass vs. Turf PhysicsBounce Height & Roll by Surface
Introduction
A football match is played on whatever surface the venue happens to offer, and that surface quietly rewrites the geometry of every loose ball. Drop the same ball from the same height onto freshly-cut grass, dry artificial turf, and rain-soaked grass, and three different things happen: the bounce count changes, the height each peak reaches changes, and the distance the ball rolls before stopping changes. This page is about why those three things are not independent, and how just two coefficients, one for bounces and one for rolling, capture the whole story.
The same physics matters far beyond the touchline. Tennis ball manufacturers calibrate restitution to a tight tolerance because Wimbledon's grass plays differently from Roland Garros's clay. Pinball designers tune rolling friction so the ball reaches the flippers with the right speed. Even space-mission engineers landing rovers on Mars worry about the coefficient of restitution between airbag and regolith, because too elastic a contact would have the rover bouncing into a crater wall.
Many players assume a livelier surface, one that bounces higher, must also let the ball roll farther, because both feel like signs of an "energetic" pitch. The bounce and roll readouts pull that intuition apart: the two phases are governed by different coefficients and can move in opposite directions. With Drop Height = 3.0 m and Horizontal Speed = 8.0 m/s on Grass, the Bounces readout settles near 5 and the Roll Distance near 1.4 m; switching to Wet Grass cuts the bounce count to about 3 but also shortens the roll, while switching to Turf raises both. Bouncier and longer-rolling are not the same thing.
The Physics Explained
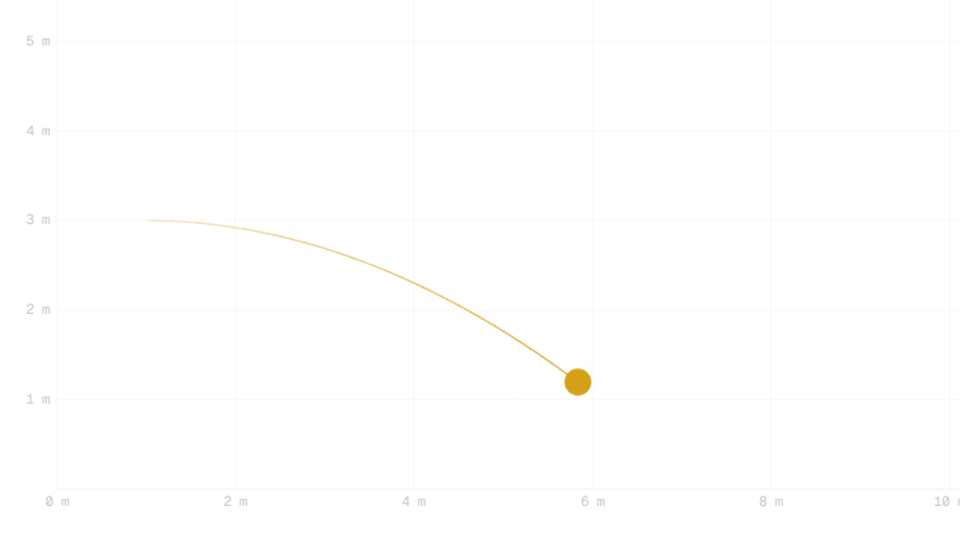
When the ball strikes the ground, it deforms and the surface beneath it deforms in turn. Some of the kinetic energy carrying the ball downward is stored briefly as elastic strain, and most of that strain is returned as the surfaces spring back. The fraction of vertical speed that returns is called the coefficient of restitution, written e. Wet Grass sits at e ≈ 0.45, Grass at e ≈ 0.55, and Turf at e ≈ 0.70 in this simulation. A ball dropped from h₀ = 3.0 m hits the ground at vy = sqrt(2·g·h₀) ≈ 7.67 m/s, so on Grass it rebounds at 0.55·7.67 ≈ 4.22 m/s and reaches a next-peak height of h₀·e² ≈ 0.91 m, a value the trail on the canvas confirms.
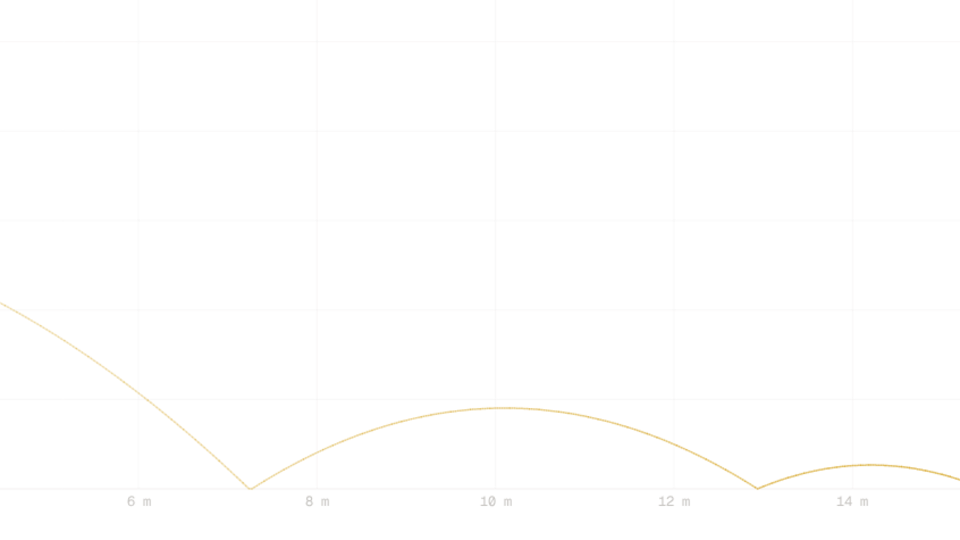
Successive peak heights follow a clean geometric series hn = h₀·e^(2n). With h₀ = 3.0 m on Grass, the sequence reads 3.00, 0.91, 0.27, 0.083, 0.025, 0.0076, and the simulation transitions to a roll once a predicted peak drops below 0.01 m. That is why the Bounces readout settles near 5 on Grass with the default drop height. Switching to Turf at the same drop height stretches the sequence to roughly 8 bounces because e² is 0.49 there instead of 0.30, and switching to Wet Grass shrinks it to about 3 because e² collapses to 0.20.
Rolling friction is the steady drag that slows a ball already in contact with the ground. It comes from micro-deformation of the surface, the small effort the ball spends climbing out of the dent it makes, and viscous coupling to any moisture present. The deceleration is aroll = μr·g, independent of speed but very dependent on the surface. Wet Grass has μr ≈ 0.45, Grass ≈ 0.35, Turf ≈ 0.20. With vx = 8.0 m/s as the pre-bounce horizontal speed, the analytical roll distance droll = vx²/(2·μr·g) (applied to that bare 8 m/s without subtracting the bounce-phase damping) is about 16.3 m on Turf, 9.3 m on Grass, and 7.3 m on Wet Grass. Each bounce trims vx by the factor (1 − ½·μr), so the simulator's actual Roll Distance readout settles much lower once the ball reaches the rolling phase: typically a metre or two for the default drop height.
The two coefficients act on different phases, and the simulation makes the separation visible. The bounce equation reverses and scales the vertical component, vy' = −e·vy, while the same impact damps the horizontal component by a fixed factor (1 − ½·μr). The Energy retained readout reports the combined loss as a percentage at the most recent contact: with Drop Height = 3.0 m, Horizontal Speed = 8.0 m/s, and Surface = Grass, the first bounce shows roughly 50 % retained, and later bounces drift higher because the vertical share of the total kinetic energy keeps shrinking while the horizontal share is hardly touched.
Key Equations
For Grass (e = 0.55) and a 3.0 m drop, the impact speed is vy = sqrt(2·9.81·3.0) ≈ 7.67 m/s, so the rebound speed is 0.55·7.67 ≈ 4.22 m/s upward. The simulator's trail shows the ball reaching its next peak shortly after this rebound, before gravity pulls it back down for contact number two.
On Grass (μr = 0.35), the per-bounce damping factor is 1 − ½·0.35 = 0.825. Starting from Horizontal Speed = 8.0 m/s, the horizontal speed after five contacts is 8.0·0.825⁵ ≈ 3.06 m/s, the value the ball carries into the rolling phase once vertical bouncing dies out.
With h₀ = 3.0 m on Grass, the predicted peaks are h₁ ≈ 0.91 m, h₂ ≈ 0.27 m, h₃ ≈ 0.083 m, h₄ ≈ 0.025 m, h₅ ≈ 0.0076 m. The fifth peak falls below the 0.01 m bounce-to-roll threshold, which is why the Bounces readout settles at 5 on the default Grass run.
For the first Grass bounce with Drop Height = 3.0 m and Horizontal Speed = 8.0 m/s: η = (6.60² + 4.22²) / (8.0² + 7.67²) ≈ 0.50, so the readout shows about 50 % retained on contact one. Later contacts read higher because the vertical share of the total kinetic energy has shrunk.
If the rolling phase begins with vx ≈ 3.06 m/s on Grass (μr = 0.35), the analytical roll distance is 3.06² / (2·0.35·9.81) ≈ 1.36 m. The simulator's Roll Distance readout lands close to that value once the ball has settled into pure rolling and friction has carried vx below 0.05 m/s.
Key Variables
| Symbol | Name | Unit | Meaning |
|---|---|---|---|
| e | Coefficient of restitution | dimensionless | Vertical-speed ratio at a bounce; 0.45 Wet, 0.55 Grass, 0.70 Turf |
| μr | Rolling-friction coefficient | dimensionless | Lateral deceleration as a fraction of g; 0.20–0.45 here |
| g | Gravitational acceleration | m/s² | 9.81 near Earth's surface |
| h₀ | Drop height | m | Initial release height; 3.0 m by default |
| vx | Horizontal speed | m/s | Initial sideways speed; 8.0 m/s by default |
| vy | Vertical speed at contact | m/s | sqrt(2·g·h) at first contact, then attenuated by e |
| η | Energy retained | dimensionless | Kinetic-energy fraction surviving a bounce |
| n | Bounce count | integer | Surface contacts before the rolling phase begins |
Real World Examples
Why does a wet pitch feel slower than a dry one?
Coaches and commentators describe rain-soaked grass as a "slow" pitch, and the description is literal rather than poetic. Two effects stack. First, water films coat the grass blades, so a portion of the ball's downward kinetic energy goes into squeezing that water aside instead of into elastic strain that would be returned. The coefficient of restitution drops from a dry-grass value near 0.55 to a wet-grass value near 0.45. Second, the same water increases viscous resistance once the ball is rolling, lifting the rolling-friction coefficient from about 0.35 to 0.45.
The simulator separates the two effects cleanly. With Drop Height = 3.0 m and Horizontal Speed = 8.0 m/s, switching the Surface slider from Grass to Wet Grass drops the Bounces readout from about 5 to about 3 (the e effect on the vertical phase) and the Roll Distance readout from roughly 1.4 m to under 1.0 m (the μr effect on the rolling phase). A driven 30 m pass on the same wet field would arrive a beat later than the players' muscle memory expects, which is exactly why training on a wet pitch produces a different first-touch rhythm from training on a dry one.
Why does artificial turf produce more skid than grass?
Artificial turf is engineered to drain quickly and to keep its bounce characteristics nearly constant across temperature and weather. The cost of that consistency is a higher coefficient of restitution and a lower rolling-friction coefficient than natural grass, because the synthetic fibres deform much less under the ball than living grass blades do. Players notice the result instantly: the ball comes off the turf faster, sits up at unexpected heights, and skids further on a half-cleared loose ball.
Holding Drop Height = 3.0 m and Horizontal Speed = 8.0 m/s in the simulator and switching from Grass to Turf increases the Bounces readout from about 5 to roughly 8, and the Roll Distance readout climbs from about 1.4 m to 4–5 m. The same change explains why goalkeepers on dry artificial turf can afford soft chipped distribution into space (the bounce stays alive long enough for a teammate to control it) while their counterparts on heavy grass favour harder, flatter passes that do not rely on the second bounce sitting up at a usable height.
How many bounces should a free-kick taken from height make?
A goalkeeper's punt or a long throw-in delivers a ball at perhaps 4–5 m of release height with a horizontal speed of 10–15 m/s. The bounce-height series hn = h₀·e^(2n) sets the bounce count: solving h₀·e^(2n) ≥ 0.01 for n gives n ≤ ½·log(h₀ / 0.01) / log(e). For h₀ = 5 m and Grass (e = 0.55), n ≤ 5.2, so up to five bounces survive before the ball transitions to roll. For Turf at the same drop height the bound rises past eight, and for Wet Grass it falls to three.
The simulator confirms the formula directly. With Drop Height = 5.0 m, Horizontal Speed = 0 m/s, and Surface = Grass, the Bounces readout settles at 5; raising the slider to Turf without any other change pushes it toward 8; dropping it to Wet Grass takes it to 3. That is the underlying reason a single goal kick at the start of a rainy match can travel 60 m, land, take one short bounce, and stop, while the same goal kick at the start of a dry artificial-turf match keeps moving for several seconds after first contact.
Further Reading
- Foot–ball collision: the same coefficient-of-restitution physics applied to the boot–ball impact at the moment of the kick rather than the ball–ground impact at landing.
- Penalty kick vs. keeper: how launch speed and angle convert into shot trajectory once the bounce has died and the ball is in flight.
- Corner kick into the box: sideways launch geometry that lands inside the six-yard area, where the surface coefficients on this page govern what happens after first contact.
- Magnus free kick: the spin-curved trajectory the present simulation deliberately omits, completing the picture once bounce and roll are understood.