Work by a Variable Force · SimulatorArea Under F(x) Equals KE
Drag a force-vs-position curve; the area under it computes total work and matches the kinetic energy gained
Published: July 3, 2026
Objective
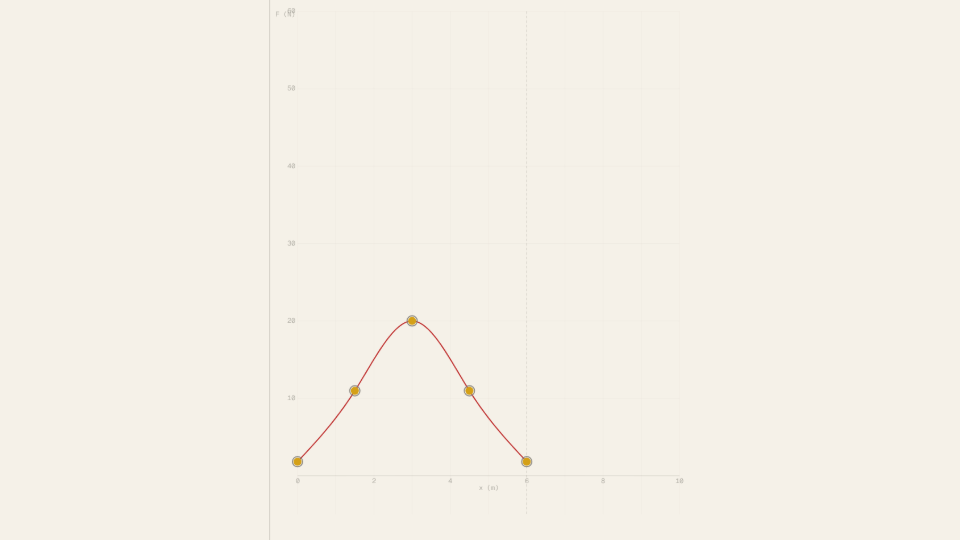
Verify the work-energy theorem for a non-constant force: show that the area under the F(x) curve from start to finish equals the kinetic energy gained by the block. The model assumes a frictionless horizontal track, a point-mass block, and a force profile set by five draggable control points interpolated with a natural cubic spline.
Setup
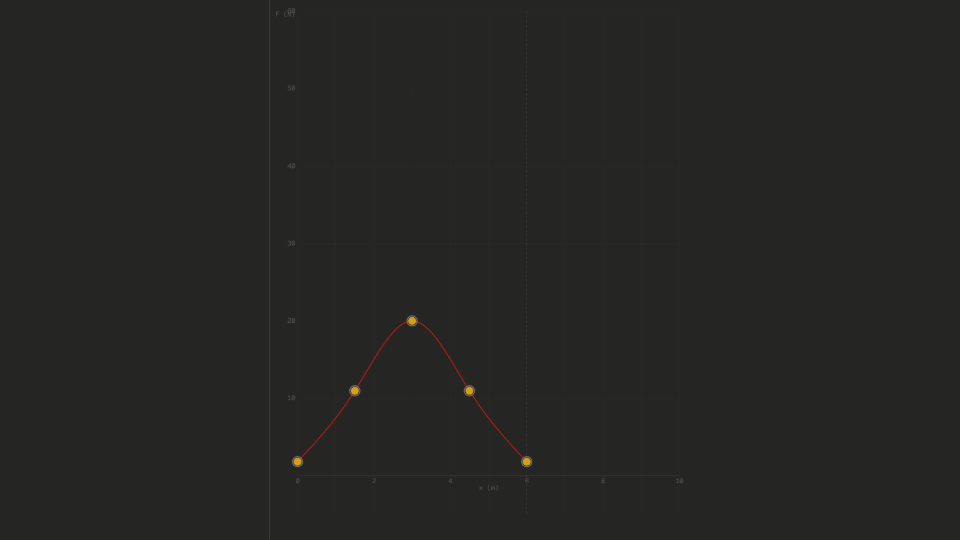
- Leave all sliders at their defaults (mass = 1.0 kg, peak force = 20 N, track length = 6 m) and note the bell-shaped spline in the F(x) panel. The amber shaded area is zero before the block moves.
- Press Start and watch the amber area grow as the block advances. Observe the Work done (J) and Kinetic energy (J) readouts in the control panel.
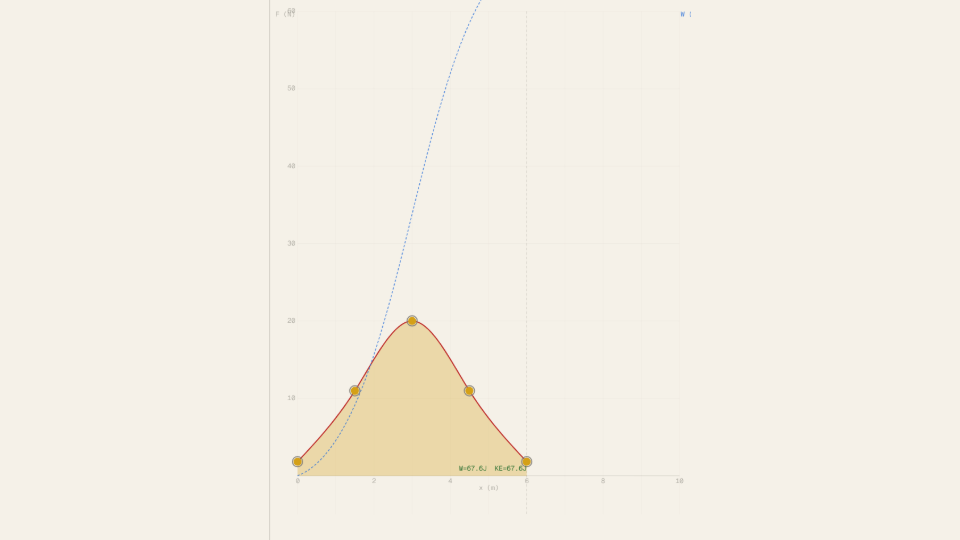
- When the block reaches the track end the sim stops. Record the final Work and KE values and confirm they match.
- Press Reset, then drag the middle control point (the peak) upward to roughly 35 N and press Start again. Note the larger final area and higher final KE.
- Press Reset and set mass to 3.0 kg (peakForce stays elevated). Note that the same shaped curve gives the same Work but a lower final speed, since KE = ½mv².
Analytical Prediction
With the default settings (mass = 1.0 kg, peakForce = 20 N, trackLength = 6 m), the control points are at (0, 1.81 N), (1.5, 10.98 N), (3, 20 N), (4.5, 10.98 N), (6, 1.81 N). The natural cubic spline through these knots bulges above the straight chords between them, so its integral exceeds the trapezoid estimate over the knots. Trapezoid estimate across the four panels (each 1.5 m wide):
The cubic spline adds roughly 2.0 J from the upward bowing between knots:
At the finish:
The Work readout and KE readout should both reach approximately 67.6 J when the block exits the track.
Results Analysis
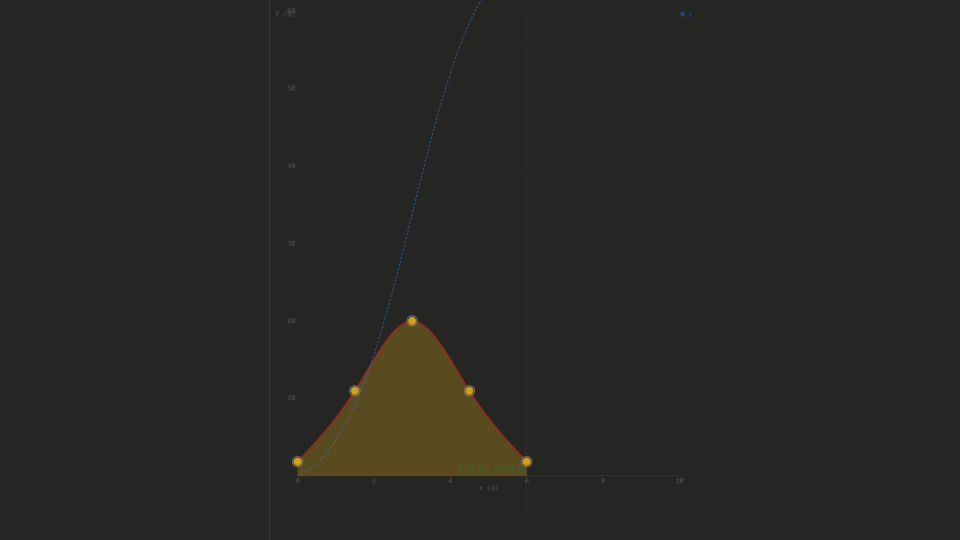
After pressing Start with the default sliders, watch the Work done (J) and Kinetic energy (J) readouts update each tick. Both values should climb together and converge to the same number at the finish. At the default settings both readouts should read approximately 67 J to 68 J when the block reaches the track end. The amber shaded area in the F(x) panel is the graphical representation of the integral: its extent at x = 6 m corresponds to the work value shown in the HUD. The sky-blue dashed W(x) overlay traces the running integral and should sit visually at the top edge of the amber shading at every position. If you increased the peak force to 35 N in Step 4, the final work will be larger (roughly 35/20 × 67.6 ≈ 118 J) and the block will exit faster.
Source of Error
The simulation models a frictionless horizontal surface; any real block would lose energy to friction and surface deformation, reducing the final KE below the predicted work. The force profile is defined by five control points only, so it cannot represent an arbitrarily complex real-world force distribution. The numerical integration uses Simpson's rule with 2000 steps per evaluation, introducing a quadrature error below 0.1 J across the default slider range. Forward-Euler position integration introduces a velocity drift proportional to the timestep; the residual gap between the Work and KE readouts at the stop frame is therefore purely numerical, not physical, for this sim.
Further Exploration
- Drag the middle control point to zero (flat bottom). What happens to the total work? Does the block still reach the end, or does it stall? At what minimum peak force does the block just barely finish?
- Set mass to 0.5 kg and then 5.0 kg with the same curve. The Work readout should be identical at the finish, but the speed should differ by a factor of sqrt(10) ≈ 3.16. Check this with the Speed (m/s) readout.
- Set peak force to 50 N and track length to 10 m. How does the total work scale compared to the default? Is the relationship linear in peak force? In track length?
- Drag the first control point (x = 0) up to 30 N and the last point (x = L) also to 30 N, creating a near-flat high-force profile. Compare the final KE to a sharply peaked bell with the same peak force.
- After a completed run, press Reset (which keeps the grey ghost spline in the graph). Run again with the track length shortened to 3 m. How do the two ghost curves compare in the graph panel?