Roller Coaster · SimulatorKE, PE, and Energy Conservation
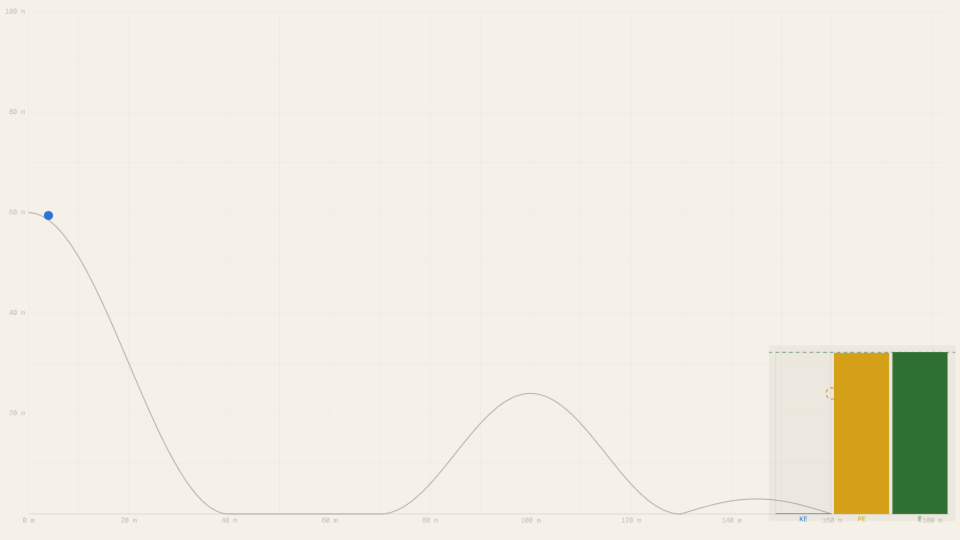
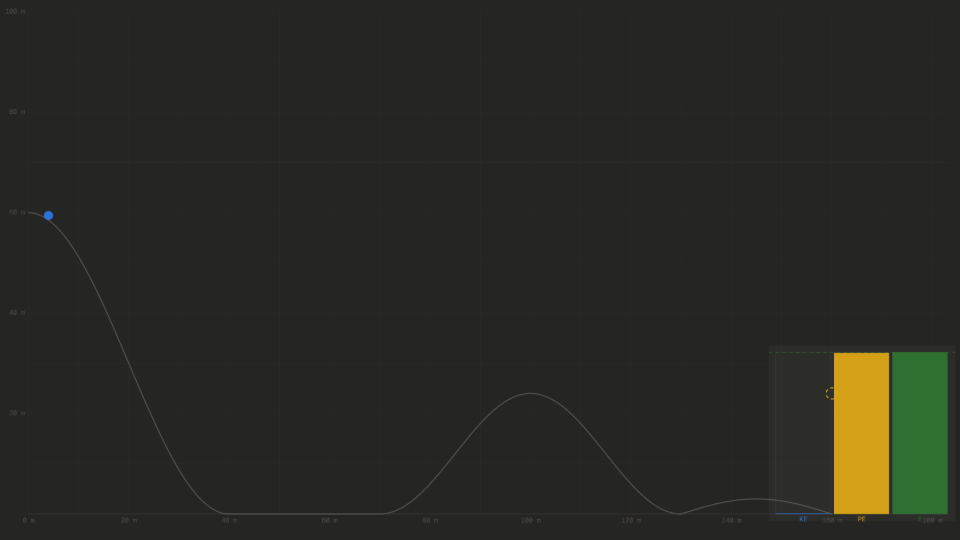
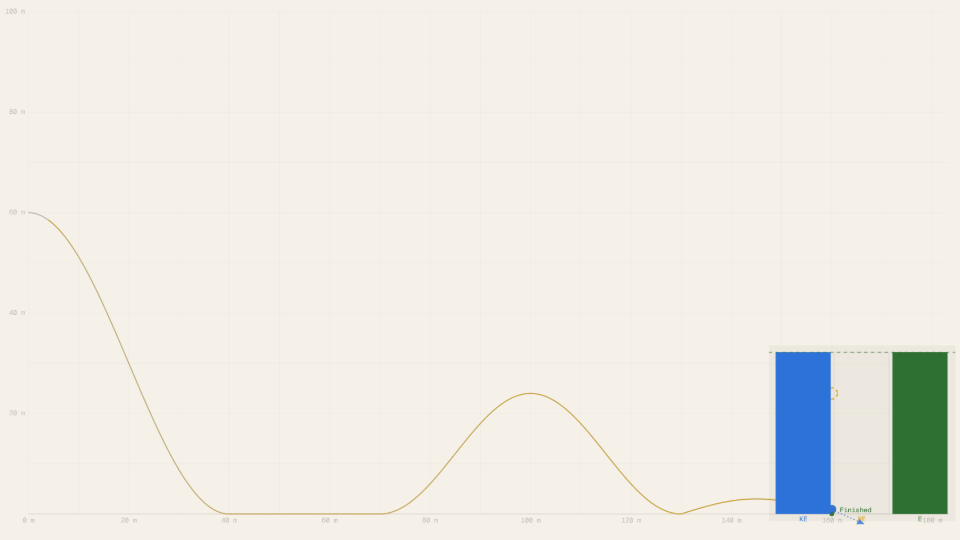
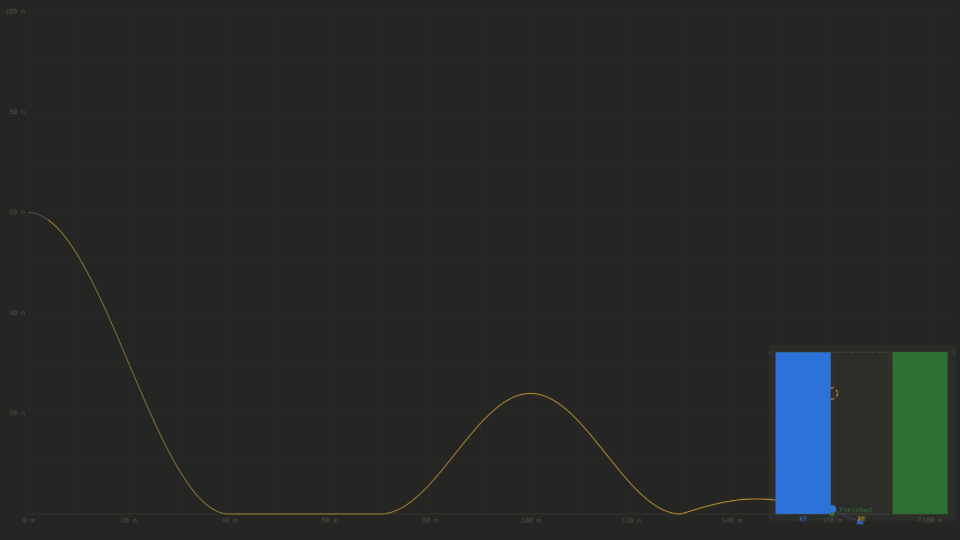
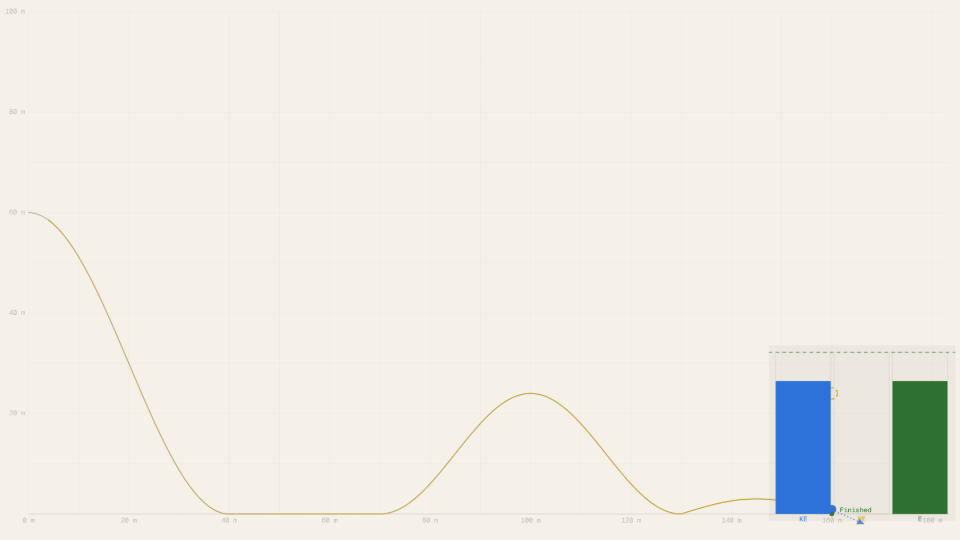
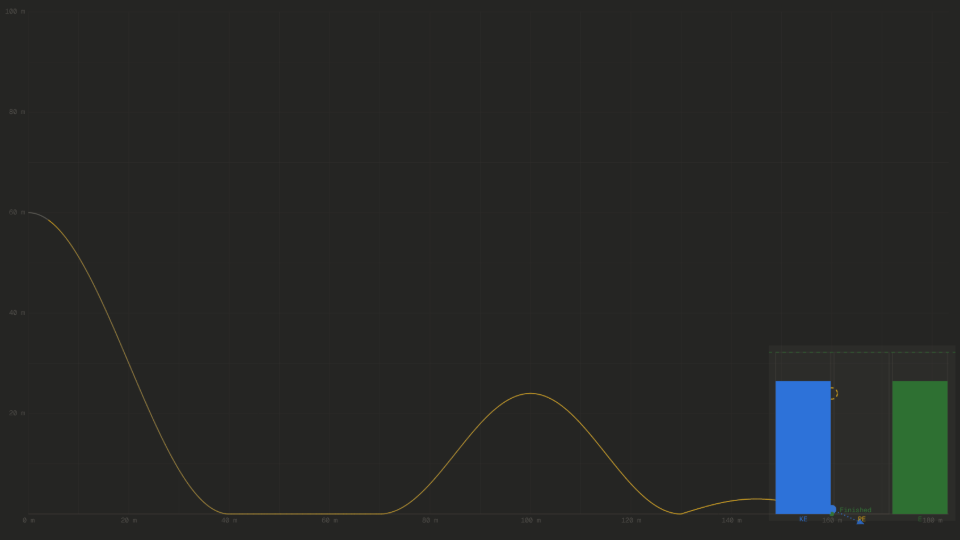
A cart on a track with hills and a loop; live KE, PE, and total-energy bars show energy conservation throughout the run.
Published: July 3, 2026
Objective
Verify that mechanical energy (KE + PE) is conserved when friction is off, and observe how friction drains total energy over the run. Confirm that the cart's speed at any point on the track depends only on height, not on mass or track shape, and identify the minimum launch height needed to clear a loop of a given radius.
Setup
- Set Launch Height to 60 m, Friction to 0.000, Cart Mass to 20 kg, and Loop Radius to 12 m. These are the default values.
- Press Start and watch the cart descend from the launch hill. Observe the KE bar rising as the PE bar falls; note that the Total E bar stays flat throughout the run.
- After the run completes (or press Reset), change Friction to 0.05 and press Start again. Compare how the Total E bar now declines across the run.
- Reset, set Cart Mass to 5 kg, and press Start. Record the speed readout at the valley floor. Then set Cart Mass to 50 kg and repeat. Note whether the speed changes.
- Reset, set Launch Height to 20 m with Loop Radius at 12 m (below the 30 m minimum). Press Start and observe the cart stalling on the loop with a cross marker.
- Set Launch Height to 35 m (above the 30 m minimum) and press Start. Confirm the cart clears the loop and reaches the finish.
Analytical Prediction
The cart is released just past the crest, at track position x = 4 m where the launch hill has real gradient: launch height h₀ = 58.53 m (at the Launch Height slider's default 60 m), with a small 2 m/s release push. Initial total energy:
At the valley floor (h = 0), all of it is kinetic:
At the loop apex (h = 2 · R = 24 m):
The minimum launch height to clear a loop of radius R combines the apex condition v² ≥ g·R with energy conservation: h₀ ≥ 2.5 · R, so 30 m for the default R = 12 m.
Results Analysis
Run the simulation with the default settings (Launch Height 60 m, Friction 0.000, Cart Mass 20 kg, Loop Radius 12 m). At the valley floor the Speed readout should read approximately 33.95 m/s and the KE readout approximately 11.52 kJ, matching the analytical prediction within the integration tolerance. The Total E readout should hold at 11.52 kJ throughout the frictionless run: that constancy IS the conservation law, verified numerically every frame. Note the readout shows 11.52 kJ rather than m·g·60 = 11.77 kJ because the cart is released at x = 4 m on the descending slope (h₀ = 58.53 m), not at the flat crest itself. With Friction raised to 0.050, the Total E readout visibly declines as the cart advances and the Distance readout grows; the energy lost equals μ · m · g times the arc length travelled.
Source of Error
This simulation treats the cart as a point mass sliding on a frictionless centerline; it omits rolling resistance, air drag, wheel rotation, and track banking. The friction model uses a flat kinetic coefficient applied to arc-length rather than a normal-force-dependent Coulomb model, so the friction work is proportional to distance, not the actual contact-force variation around the loop. The track profile uses cosine-blended segments rather than a true polynomial spline, so the curvature is not continuous at segment boundaries. These idealizations are shared by the analytical prediction in the same section, so they cancel in the residual. The remaining gap between predicted and displayed values is purely numerical.
Further Exploration
- Set Launch Height to its maximum (80 m) and Loop Radius to 20 m. Does the cart clear the loop? The minimum height for R = 20 m is 50 m, so 80 m gives a 30 m safety margin. What is the cart's speed at the apex?
- With Friction at 0, vary Cart Mass from 5 to 50 kg while watching the Speed readout at the valley. Does the speed change? Why does mass cancel out of the energy-conservation equation?
- Set Launch Height to exactly 30 m and Loop Radius to 12 m (the theoretical minimum). Does the cart barely clear, stall, or fall short? Try 31 m and 29 m to bracket the boundary.
- Drag Friction from 0 to 0.10 in steps and observe the Total E bar during each run. At what friction value does the cart first stall before reaching the finish?
- Set Launch Height to 60 m and Loop Radius to 8 m. How does reducing the loop radius change the apex speed and the margin above the stall speed?