Net Work with Friction · SimulatorWork, Friction, and the Work-Energy Theorem
A block pushed across a surface with friction; work done by each force tabulated and summed to net work = ΔKE.
Published: July 3, 2026
Objective
Verify the work-energy theorem for a block pushed across a rough horizontal surface. The simulation tabulates work by the applied force (W_applied = F·d) and by kinetic friction (W_friction = −μk·m·g·d), then confirms that their algebraic sum, the net work, equals the block's final kinetic energy (ΔKE = ½mv_f²).
Setup
- Set Applied Force to 25 N, Friction Coeff. μk to 0.25, Mass to 3 kg, and Track Length to 10 m (the default configuration).
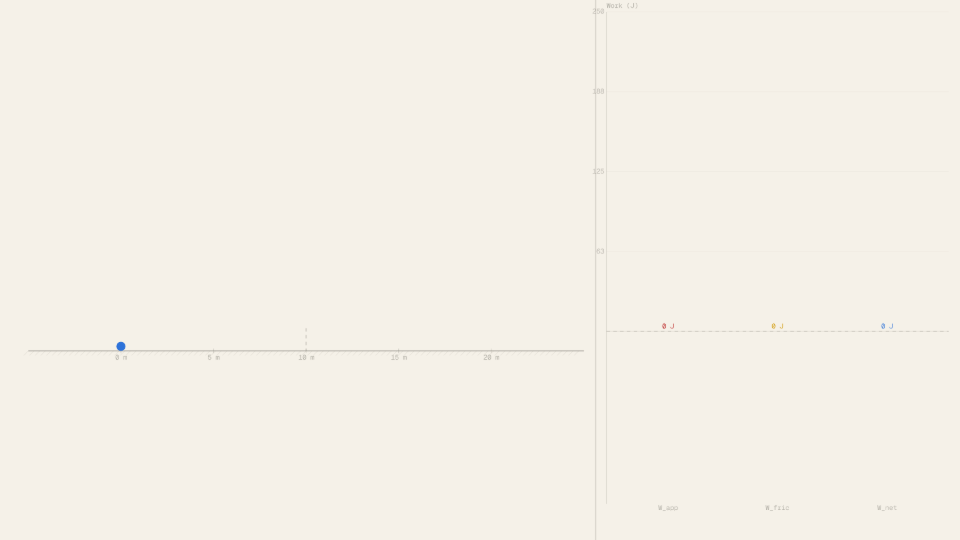
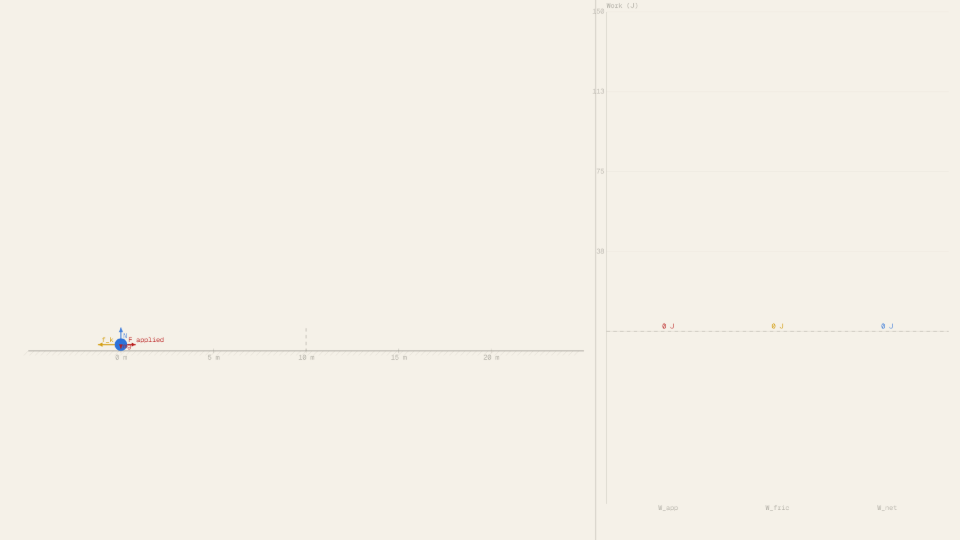
- Press Start. Watch the block slide rightward; the bar chart on the right updates the W_applied, W_friction, and W_net bars live.
- When the block reaches the track end, record the W_applied, W_friction, W_net, KE, and Speed readouts.
- Press Reset, then increase μk to 0.50. Start again and record how the W_friction bar and final speed change.
- Finally, try the no-motion edge case: set Applied Force to 5 N, μk to 0.70, Mass to 10 kg. Press Start and observe that all work readouts stay at 0.0.
Analytical Prediction
With F = 25 N, μk = 0.25, m = 3 kg, and d = 10 m, the kinetic friction force is f_k = μk·m·g = 0.25 · 3 · 9.81 = 7.36 N. The net force on the block is F_net = F − f_k = 25 − 7.36 = 17.64 N.
By the work-energy theorem, the final kinetic energy equals the net work:
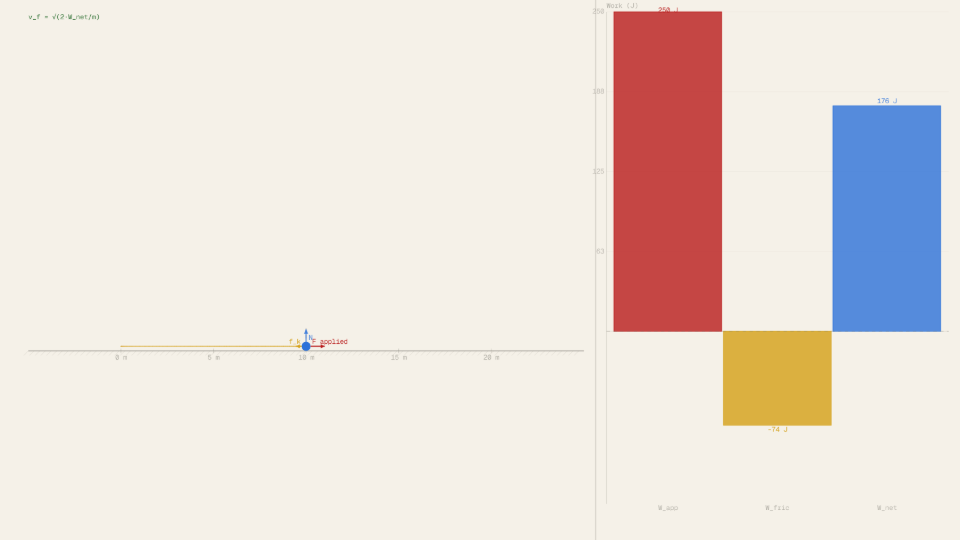
Expected readouts at the stop frame: W applied ≈ 250.0 J, W friction ≈ −73.6 J, W net ≈ 176.4 J, KE ≈ 176.4 J, Speed ≈ 10.84 m/s.
Results Analysis
After the block crosses the full 10 m track, compare the simulation readouts to the predicted values. The W applied readout should show approximately 250.0 J (F · d = 25 · 10), and W friction should show approximately −73.6 J (−μk · m · g · d = −0.25 · 3 · 9.81 · 10). The W net readout should show ≈ 176.4 J, matching the KE readout to within 0.1 J (less than 0.1% error for typical configurations). The Speed readout should show ≈ 10.84 m/s; independently, ½ · 3 · 10.84² ≈ 176.4 J confirms the KE consistency. The bar chart makes the partial cancellation unmissable: the green W_applied bar is taller than the blue W_net bar by exactly the magnitude of the red W_friction bar.
Source of Error
The model assumes a flat, rigid horizontal surface with constant kinetic friction coefficient throughout the run. It omits air drag on the block, rotational inertia (the block does not roll), static-to-kinetic friction transition at startup, and any deformation or heating of the surface. Normal force is assumed constant (N = mg), which holds only for horizontal motion with no vertical acceleration. The analytical prediction in the Setup section assumes the same idealizations, so they cancel in the residual. Any residual gap between the W_net readout and the KE readout is therefore purely numerical (Euler integration overshoot at the track-end boundary), not physical.
Further Exploration
- Set μk to its maximum (0.70) and sweep Applied Force from low to high. At what force does the block just barely start moving? Can you predict the threshold from f_k = μk·m·g?
- Keep F = 25 N and m = 3 kg fixed, then double the Track Length from 10 m to 20 m. Do W_applied and W_net also double? Does the final speed double?
- Set m to 10 kg and F to 25 N. How does the larger mass affect the friction force, the W_friction bar, and the final speed compared to m = 3 kg?
- Find a slider combination where W_net is exactly half of W_applied (friction does exactly half the negative work). What does that imply about μk · m · g relative to F?
- Run the default configuration, then press Reset to archive the ghost. Increase μk to 0.50 and run again. Compare the two W_net bars in the chart and the two trail lengths on the canvas.