Velocity-Time Plotter SimulatorArea Under the v–t Curve
A cart with adjustable constant acceleration; a dual-axis chart plots velocity (left axis, blue) and position (right axis, green) against time, with the shaded triangle showing that area-under-v equals displacement.
Published: May 10, 2026 · Updated: May 31, 2026
Objective
Confirm that the area under a velocity-time graph equals displacement by reading both quantities directly from a dual-axis chart. Starting from rest with adjustable constant acceleration, the simulation plots v(t) = a·t against the left (blue) axis and x(t) = ½·a·t² against the right (green) axis, with the shaded triangle making the area-equals-displacement identity visible at every instant.
Setup
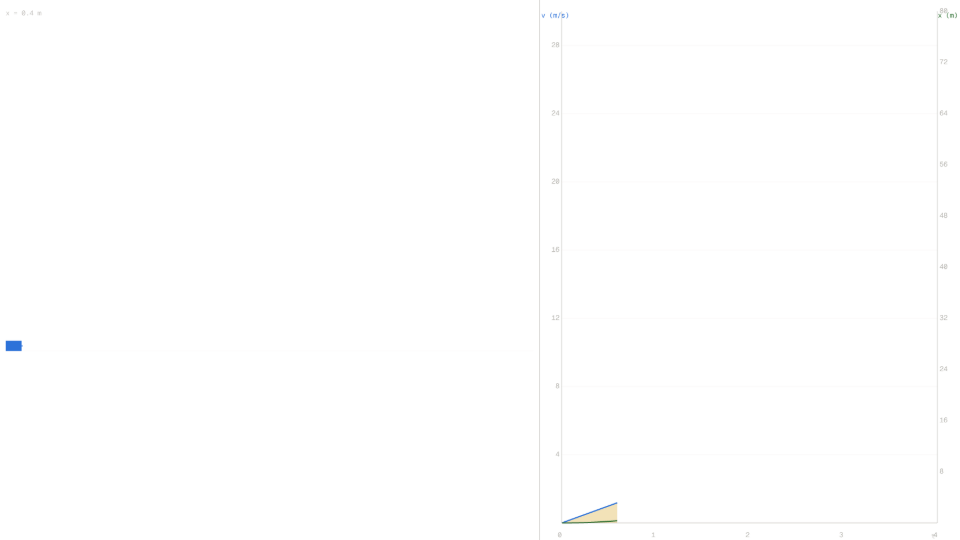
- Press Reset. The cart is at the left of the track and the chart is empty. The Acceleration slider shows 2.0 m/s² (the default).
- Press Start. The cart accelerates rightward; the blue v-line climbs linearly while the green x-curve traces an upward parabola. The amber-shaded triangle under the v-line grows in proportion to the cart's displacement.
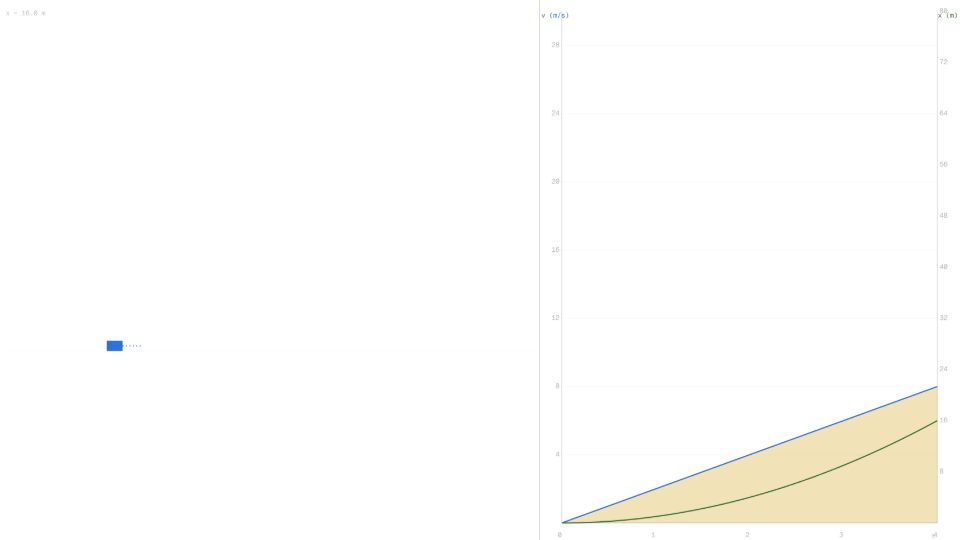
- At t = 4.00 s the simulation stops automatically. Read the Velocity (8.00 m/s) and Displacement (16.00 m) readouts. Verify the green curve's right-axis reading at t = 4 s also points at 16 m.
- Compute the triangle area: ½ × 4.00 × 8.00 = 16.00 m. The same number appears as the Displacement readout and as the green curve's endpoint on the right axis: three independent paths to the same value.
- Press Reset and slide Acceleration to 4.0 m/s². Predict the readouts at t = 3.00 s: v = 12.00 m/s, x = ½·4·9 = 18.00 m. Press Start and verify both: the blue line is now steeper and the green parabola fills more of the right-axis range.
Analytical Prediction
For constant acceleration starting from rest, kinematics gives:
With a = 2 m/s² at the natural stop t = 4 s:
The area of the triangle under the v-t line is ½·base·height = ½·t·v:
The area equals the displacement exactly; that is the geometric meaning of integration. The Velocity (m/s) readout, the Displacement (m) readout, and the value of the green x(t) curve read off the right axis at t = 4 s all show 16.00 m at the natural stop.
Results Analysis
While the simulation runs, three independent indicators move in lock-step. The blue v-line is the slope a·t. The amber shaded area is the running integral ½·v·t. The green x-curve is the closed-form ½·a·t². For a = 2.0 m/s² at t = 2.00 s the readouts show v = 4.00 m/s and x = 4.00 m; the green curve at that x-coordinate intersects the right axis at the 4 m gridline. At t = 4.00 s the readouts show v = 8.00 m/s and x = 16.00 m; the green curve's endpoint sits at 16 m on the right axis and the shaded triangle's area equals 16 m². The dual-axis layout makes it impossible to read v without seeing x; the integration is always visible.
Source of Error
This model treats the cart as a point mass with perfectly constant acceleration: no rolling friction, no air drag, no wheel inertia, no track deformation. The analytical prediction applies the same idealizations, so model and formula omit the same physics; the residual gap is not physical in origin. Position and velocity are evaluated from closed-form expressions (x = ½·a·t², v = a·t) rather than from accumulated numerical integration, so the displacement identity x = ½·v·t holds exactly to floating-point precision.
Further Exploration
- Maximum acceleration. Set Acceleration to its maximum (5.0 m/s²) and press Start. At the natural stop t = 4 s the predicted values are v = 20 m/s and x = ½·5·16 = 40 m. Does the right axis end exactly at 40 m and the left axis at 20 m? The blue v-line is now at the chart's left-axis ceiling and the green x-curve at the right-axis ceiling.
- Minimum acceleration. Set Acceleration to 0.5 m/s² and run to natural stop. Predict v = 2 m/s and x = ½·0.5·16 = 4 m. The blue line stays near the bottom of the left axis and the green curve barely climbs; the same dual-axis chart now shows the shallowest possible parabola in the slider range.
- Read the right axis at t = 2 s. For a = 3 m/s² at t = 2 s, the predicted x = ½·3·4 = 6 m. Pause the sim at t ≈ 2 s and confirm the green curve crosses the 6 m gridline on the right axis. Does the Displacement readout match?
- Area-ratio at fixed time. Compare a = 1 m/s² and a = 4 m/s² at t = 4 s: predicted x is 8 m vs 32 m, a 4× ratio, matching the acceleration ratio. Run both and check that the green endpoints sit at 8 m and 32 m respectively, and the shaded triangles' areas reflect the same 4× factor.