Feather and Hammer · SimulatorDrop Both in a Vacuum
A feather and hammer dropped together with adjustable air density, from perfect vacuum to full atmosphere.
Published: May 11, 2026 · Updated: June 5, 2026
Objective
Verify that in a vacuum all objects fall with identical acceleration regardless of mass, and that air resistance, scaled by the drag-to-mass ratio, is the sole cause of the familiar feather-vs-hammer difference. The simulation models Newtonian quadratic drag (F = ½ · ρ · C_d · A · v²) for a feather and a hammer whose drag-to-mass ratios differ by a factor of 25, letting the user sweep air density from pure vacuum to standard atmosphere.
Setup
- Set Air Density to 0.00 kg/m³ (vacuum) and Drop Height to 20 m. Press Start and observe both the Feather and Hammer height readouts; they should track together and the Separation readout should remain at 0.00 m throughout.
- When both objects land, press Reset. Drag Air Density to 1.225 kg/m³ (standard atmosphere) while keeping Drop Height at 20 m. Press Start and watch the Feather and Hammer readouts immediately begin to diverge.
- Note the Time and Separation readouts the moment the Hammer height first reads 0.00 m; the feather will still be several metres above ground. Record both values.
- Press Reset, increase Drop Height to 50 m, keep Air Density at 1.225 kg/m³, and press Start. Record the Separation when the Hammer lands to compare with the 20 m run.
Analytical Prediction
In vacuum the free-fall time from h = 20 m follows t = sqrt(2h/g). With h = 20 m and g = 9.81 m/s²:
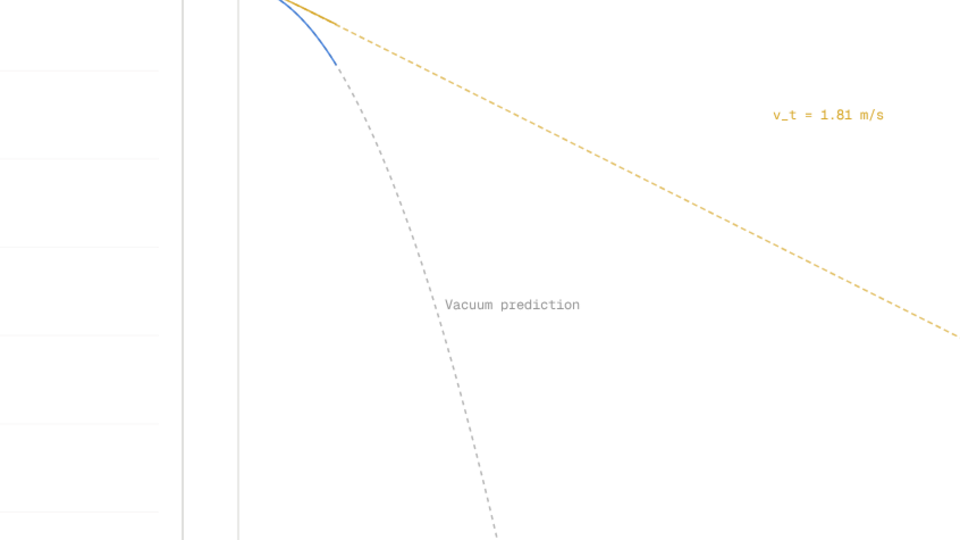
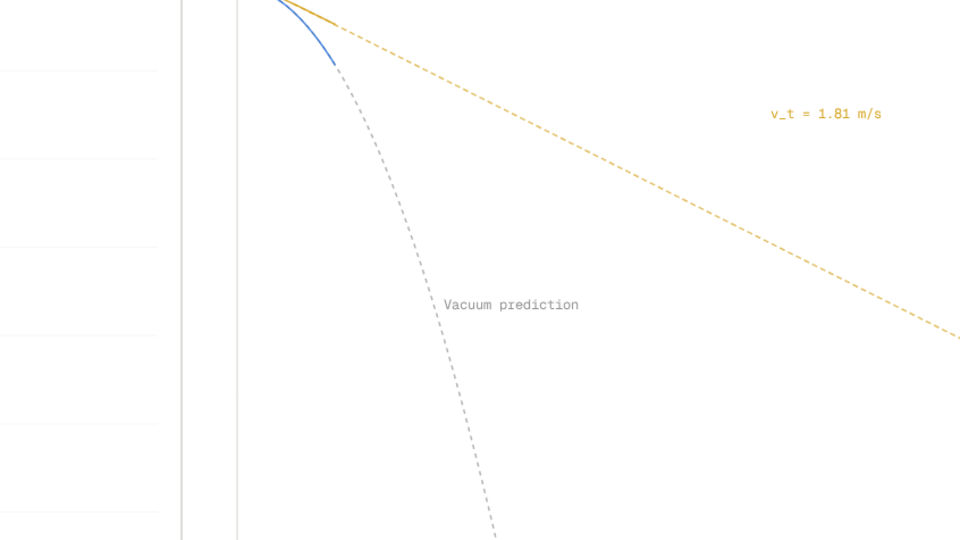
Both objects land at t ≈ 2.02 s and Separation stays 0.00 m. With standard air (ρ = 1.225 kg/m³) the feather's terminal velocity is v_t = sqrt(2·m·g / (ρ·C_d·A)) ≈ sqrt(2 · 0.005 · 9.81 / (1.225 · 0.05)) ≈ 1.27 m/s, while the hammer's terminal velocity is ≈ sqrt(2 · 0.5 · 9.81 / (1.225 · 0.002)) ≈ 63 m/s, effectively free-fall over the 20 m drop. The feather therefore lags far behind, still metres above ground when the hammer lands.
Results Analysis
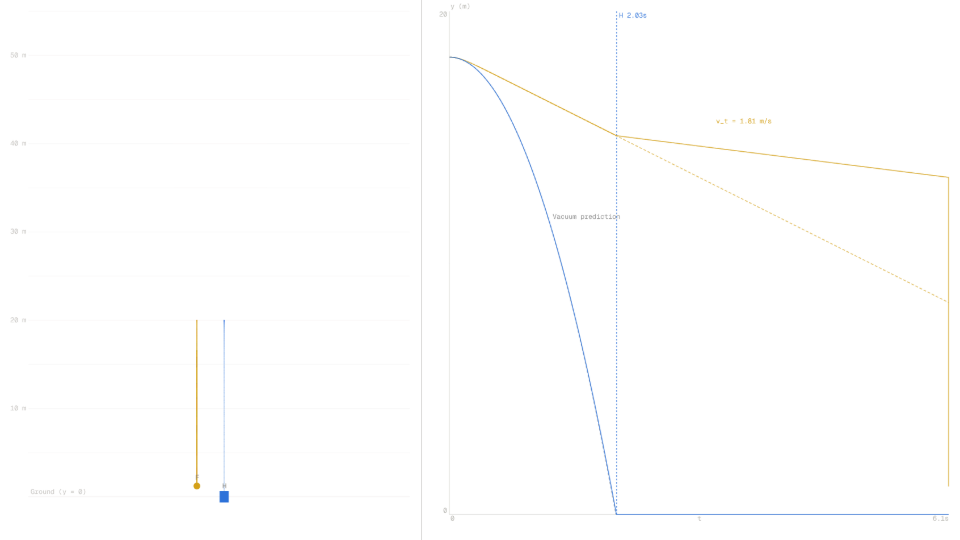
Run the vacuum case (Air Density = 0.00, Height = 20 m) and confirm the Separation readout stays 0.00 m and the Time readout shows ≈ 2.02 s at landing, matching the analytical prediction to within a few hundredths of a second. Then switch to atmosphere (Air Density = 1.225) with the same height: the Feather height readout should be noticeably above 0.00 when the Hammer height first reads 0.00. The right-panel graph makes the divergence vivid: in vacuum the amber (feather) and blue (hammer) traces overlap exactly; with air they separate, the feather curve bending upward relative to the hammer's parabola.

Source of Error
Both objects are treated as point masses with fixed drag coefficients: the model omits rotation, tumbling, and the orientation changes a real feather undergoes during flight. The feather's C_d · A product is fixed at 0.05 m², a rough average for a feather falling broadside; actual values vary with angle of attack. The hammer is modelled as presenting a constant face area end-on, which may understate drag at oblique angles. Both the simulation and the analytical predictions above share these idealizations, so their effects cancel: the residual gap between the predicted landing time and the readout is therefore purely numerical, not physical.
Further Exploration
- Set Air Density to 0.6 kg/m³ (roughly half an atmosphere, the density at about 5 500 m altitude) and drop from 30 m. How large is the Separation when the hammer lands? Does halving the density approximately halve the separation compared with full atmosphere?
- With Air Density at 1.225 kg/m³ and Drop Height at 50 m, watch the Feather height readout near the end of the run. Does it slow its rate of change, suggesting the feather is approaching its terminal velocity of ≈ 1.27 m/s?
- Set Air Density to maximum and Height to the minimum (10 m). Does the feather reach the ground before the hammer lands, or does it linger near its terminal velocity throughout the entire drop?
- In vacuum, change Drop Height from 20 m to 40 m. Does the fall time increase by a factor of sqrt(2) ≈ 1.41 as the free-fall formula t = sqrt(2h/g) predicts, i.e., from ≈ 2.02 s to ≈ 2.86 s?