Two Runners Position SimulatorWhen & Where They Meet
Two runners with adjustable starting points and constant speeds; the simulation stops when the first runner crosses the 100 m finish line.
Published: May 10, 2026 · Updated: May 31, 2026
Objective
Verify that two constant-velocity runners coincide exactly when the analytical formula t_meet = (x₀ᵦ − x₀ₐ)/(vₐ − vᵦ) predicts, and never coincide when their speeds are equal. The race terminates the moment the first runner reaches the finish line at x = 100 m, providing a clean physical stop condition. Each runner is treated as a point mass with no acceleration, no fatigue, and no interaction with the other.
Setup
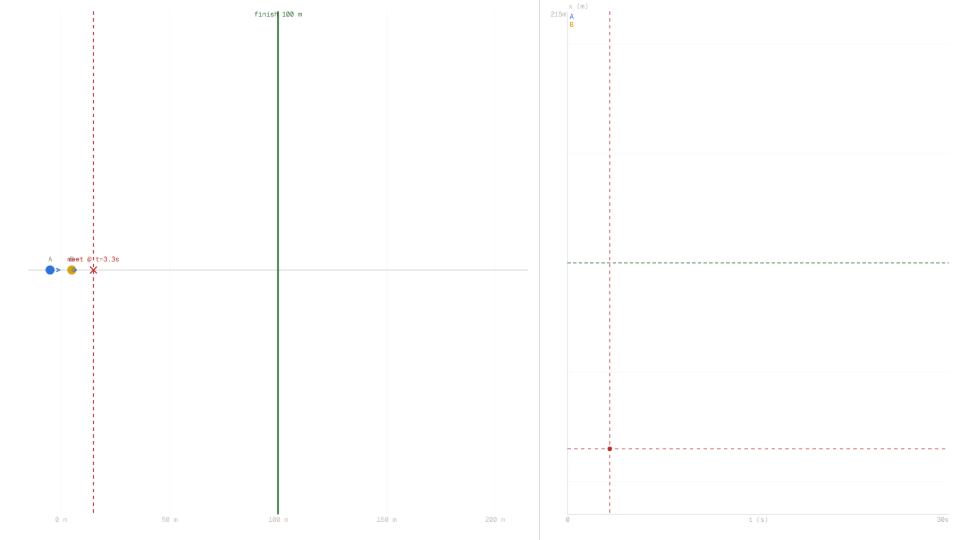
- Press Reset. Runner A start is at −5 m with speed 6 m/s; Runner B start is at +5 m with speed 3 m/s. The Gap readout shows 10.0 m (the 5 − (−5) initial separation).
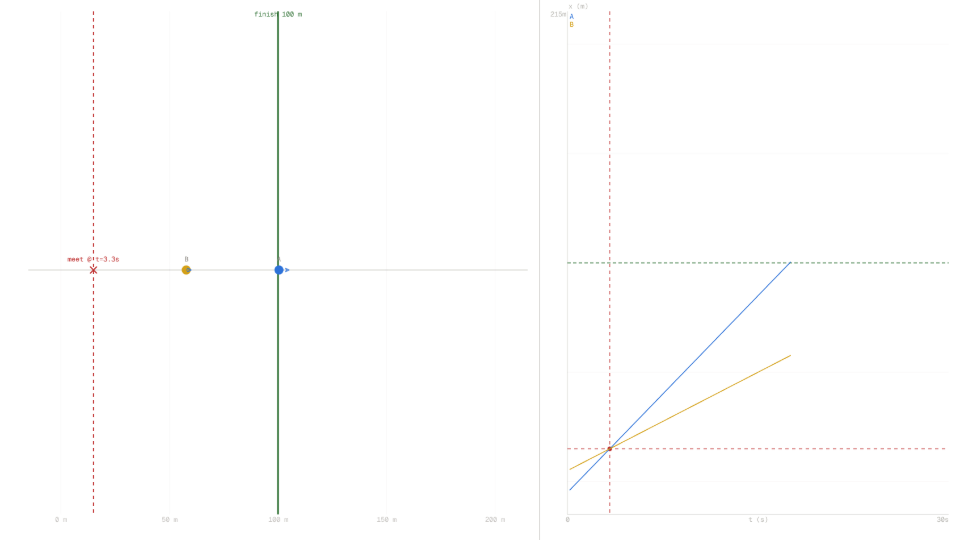
- Press Start. Both runners move rightward; the Gap readout shrinks at the relative speed vₐ − vᵦ = 3 m/s. The red meeting marker on the track shows where they will coincide.
- Watch the Time readout when the Gap first reaches 0.0 m: this should match t_meet = 10/3 ≈ 3.33 s, with both Runner A and Runner B readouts near 15.0 m.
- Continue until Runner A crosses the green finish line at 100 m. The simulation stops automatically; the Time readout freezes at 17.50 s and Runner A reads 100.0 m.
- Press Reset, set both speeds to 5 m/s, and press Start again. The Gap readout never changes: parallel x(t) lines never cross.
Analytical Prediction
Two bodies moving at constant velocities along the same line have positions xₐ(t) = x₀ₐ + vₐ·t and xᵦ(t) = x₀ᵦ + vᵦ·t. Setting them equal and solving for t gives the meeting time:
With the defaults x₀ₐ = −5 m, vₐ = 6 m/s, x₀ᵦ = 5 m, vᵦ = 3 m/s:
Both runners are at the same position at that moment:
Runner A continues past the meeting point and reaches the 100 m finish line at:
The simulation stops at t = 17.50 s with Runner A at 100.0 m. Runner B at that moment is at xᵦ = 5 + 3·17.50 = 57.5 m.
Results Analysis
With the defaults the Gap readout starts at 10.0 m and shrinks at exactly 3.0 m/s. At t ≈ 3.33 s the Gap crosses zero: both Runner A and Runner B readouts show ≈ 15.0 m and the red dashed marker on the position-time graph passes through that intersection point. The race continues; Runner A reaches the green finish line at t ≈ 17.50 s and the simulation stops with Runner A reading 100.0 m, Runner B reading 57.5 m, and the Gap reading −42.5 m. The freeze proves the natural stop condition: the simulation terminates on a physical event, not on an arbitrary timeout.
Source of Error
This model assumes both runners hold exactly constant velocity from t = 0: no acceleration phase, no fatigue, no deceleration as they approach the finish line. Real runners accelerate over the first few seconds and slow near maximum exertion. The point-mass idealization means both runners can occupy the same geometric position at the meeting time with no collision or avoidance. The analytical predictions use the same constant-velocity assumption, so both share the same physical idealizations; the residual discrepancy between the predicted meeting time (3.33 s) and the simulation readouts is therefore purely numerical, not physical, and stays within ±0.02 s.
Further Exploration
- Equal speeds, different starts. Set vₐ = vᵦ = 5 m/s with x₀ₐ = −5 m and x₀ᵦ = 5 m. The Gap readout stays at 10.0 m throughout the run because the two x(t) lines are parallel. What does this tell you about the formula t_meet = (x₀ᵦ − x₀ₐ)/(vₐ − vᵦ) when vₐ = vᵦ?
- Slower runner starts ahead. Set x₀ₐ = −5 m, vₐ = 3 m/s, x₀ᵦ = 5 m, vᵦ = 6 m/s. Runner B is faster and ahead; they never meet for positive t. What does the formula predict, and why does the simulation never show the red meeting marker?
- Speed sweep. Hold x₀ₐ = −5 m, x₀ᵦ = 5 m, vᵦ = 3 m/s and try vₐ = 4, 5, 6, 7, 8 m/s. The meeting time t_meet = 10 / (vₐ − 3) shrinks nonlinearly. Plot t_meet against vₐ on paper. Is it linear or nonlinear?
- Co-located start. Set x₀ₐ = x₀ᵦ = 0 m with different speeds. The formula gives t_meet = 0: the runners start coincident. Does the Gap readout confirm this on the very first frame?