Gas in a Piston · SimulatorExplore PV = nRT Live
Drag a piston to compress or expand a gas at fixed temperature; the pressure readout rises as volume falls (PV = nRT) while a live point traces the P–V curve in a side panel
Published: June 19, 2026
Objective
Verify the ideal gas law PV = nRT by compressing and expanding a gas at fixed temperature in a virtual piston. Observe that pressure and volume are inversely proportional (Boyle's law), that the PV product remains constant at fixed n and T, and that raising the amount or temperature shifts the entire pressure-volume isotherm upward. The gas is treated as ideal, so intermolecular forces and finite molecular volume are neglected.
Setup
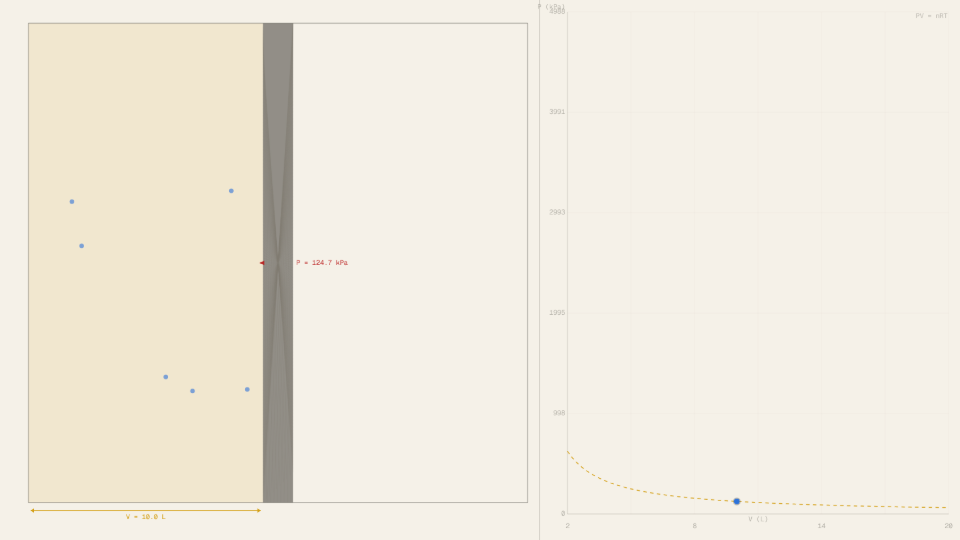
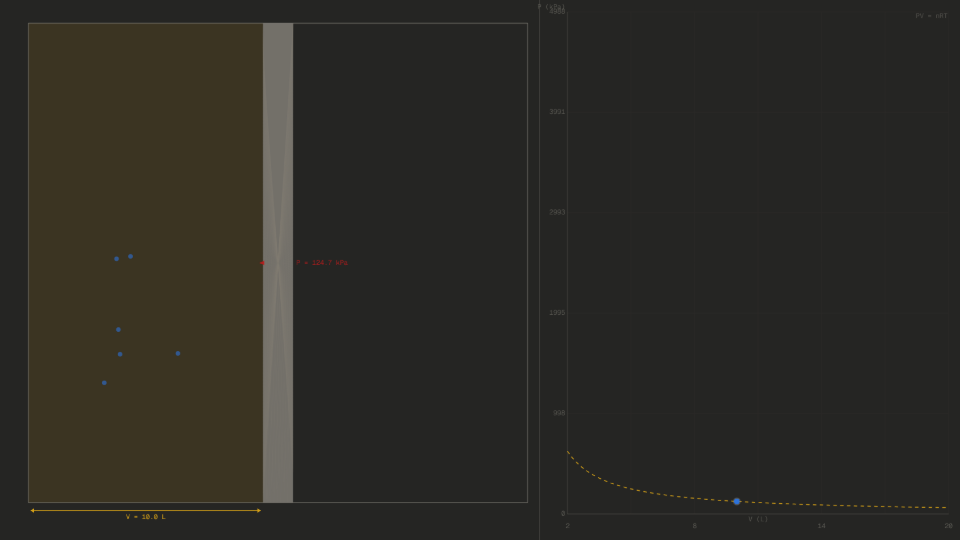
- Set Volume to 10 L, Amount to 0.5 mol, and Temperature to 300 K (the defaults). Press Start and read the Pressure readout: it should show approximately 124.7 kPa.
- While the simulation runs, note the PV readout. It displays the product P × V in joules, which should stay near 1247.1 J as time passes.
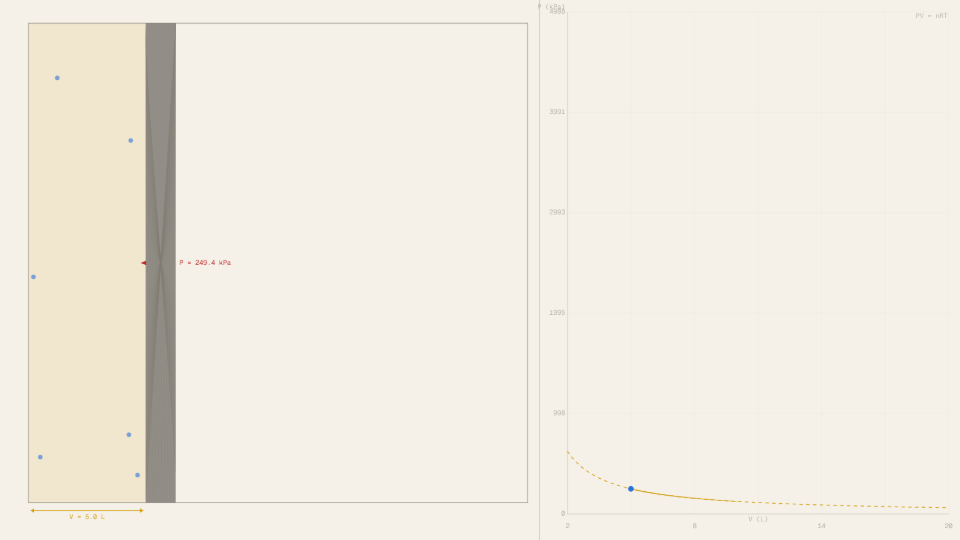
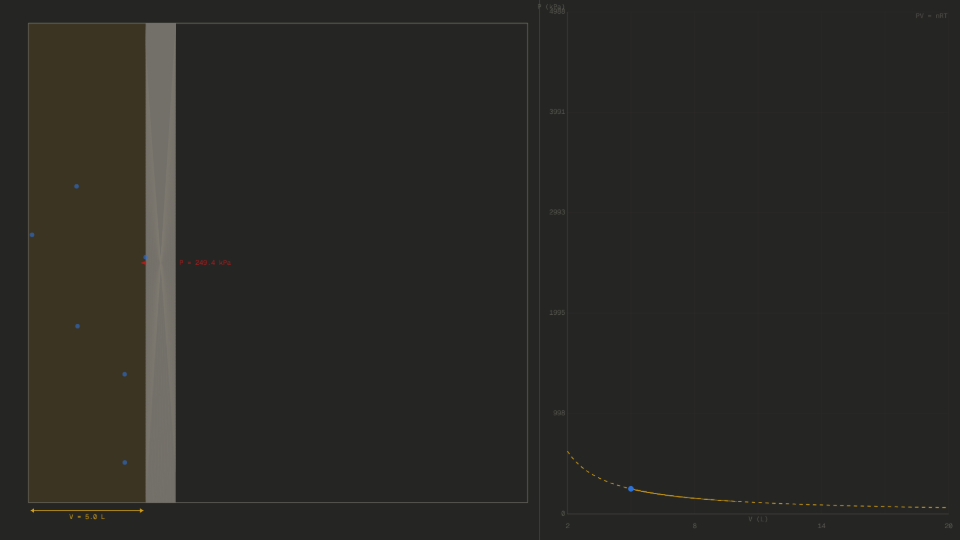
- Press Reset (the piston returns to 10 L). Move the Volume slider to 5 L and press Start again. Record the new pressure readout.
- Compare the two pressure values from steps 1 and 3. The ratio should be very close to 2 (halving V doubles P).
- Reset, then increase Amount to 1.0 mol (double the default) and press Start. Note how the pressure readout and the isotherm position change.
- Reset, set Amount back to 0.5 mol, then change Temperature to 600 K and press Start. Compare the isotherm position in the P-V panel with the one you observed at 300 K.
Analytical Prediction
For an ideal gas PV = nRT, so P = nRT / V. At default settings (n = 0.5 mol, T = 300 K, V = 10 L = 0.010 m³):
When volume is halved to 5 L = 0.005 m³ at the same n and T:
This is exactly double the original pressure, confirming Boyle's law. The PV product in both cases equals nRT = 1247.1 J and does not change as volume is swept. Doubling the moles to 1.0 mol doubles the PV product to 2494.2 J, so every pressure on the hyperbola doubles. Doubling the temperature to 600 K also doubles the PV product (2494.2 J) and therefore the pressure at every volume.
Results Analysis
After each run, compare the Pressure readout against the prediction. At V = 10 L, n = 0.5 mol, T = 300 K, the Pressure readout should display 124.7 kPa, within 0.1 kPa of the predicted value. At V = 5 L under the same conditions the readout should show 249.4 kPa. The PV readout should stay fixed at 1247.1 J across all volume changes at constant n and T, varying by no more than 0.5 J. In the P-V panel, the live dot traces the staged path, climbing vertically at fixed volume as gas and then heat are added and afterwards following the amber dashed isotherm as the piston glides to the target (a hollow ring marks where the sliders point); prior runs at different temperatures or mole amounts appear as grey ghost curves below or above the current hyperbola, making the isotherm family visible.
Source of Error
This simulation models a strictly ideal gas: molecules occupy no volume, have no intermolecular attractions or repulsions, and collide elastically with the walls. Real gases deviate from PV = nRT at high pressures (molecules are not point particles) and at low temperatures (van der Waals attractions matter). The simulation also treats the compression as a quasi-static isothermal process, meaning temperature is held exactly constant throughout, whereas a real rapid compression would heat the gas (adiabatic contribution). These physical idealizations are the only source of discrepancy between the predicted and measured pressures; the residual gap is therefore purely numerical, not physical.
Further Exploration
- Set Volume to 2 L (the minimum) and note the pressure readout. Is it exactly 5 times the pressure at 10 L? Use the formula P = nRT/V to check whether the ratio matches 10/2 = 5 at fixed n and T.
- Move the Amount slider from 0.5 mol to 1.0 mol and then to 2.0 mol. Does the isotherm in the P-V panel shift proportionally upward? What does that tell you about the role of the number of moles?
- Run two back-to-back experiments at T = 300 K and T = 600 K without pressing Clear between them. In the P-V panel, how far apart are the two isotherms, and does the separation match the predicted ratio of 2?
- Fix Volume at 10 L and sweep Temperature from 200 K to 600 K. The pressure should change from about 83.1 kPa to 249.4 kPa. Does the Pressure readout scale linearly with T, as PV = nRT predicts?
- Set Volume to its minimum (2 L) and Amount to its maximum (2.0 mol) at T = 600 K. The pressure should reach approximately 4988 kPa (about 49 atm). What does this extreme condition suggest about the validity of the ideal gas approximation in a real gas cylinder?